Search
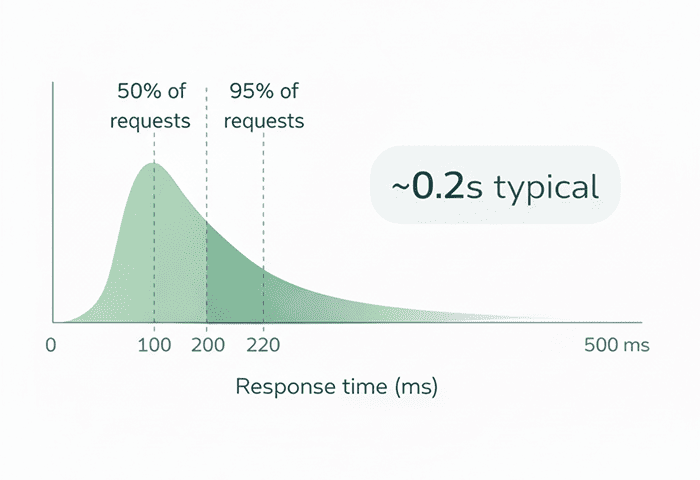
Find stocks, ETFs, and funds across global markets in ~0.2 seconds. Filter by country, industry, performance, and more — across 614,000+ assets.
Explore global investment opportunities with real-time and historical data. Search, filter, and compare assets — then save your picks into watchlists and screeners for faster, smarter decisions


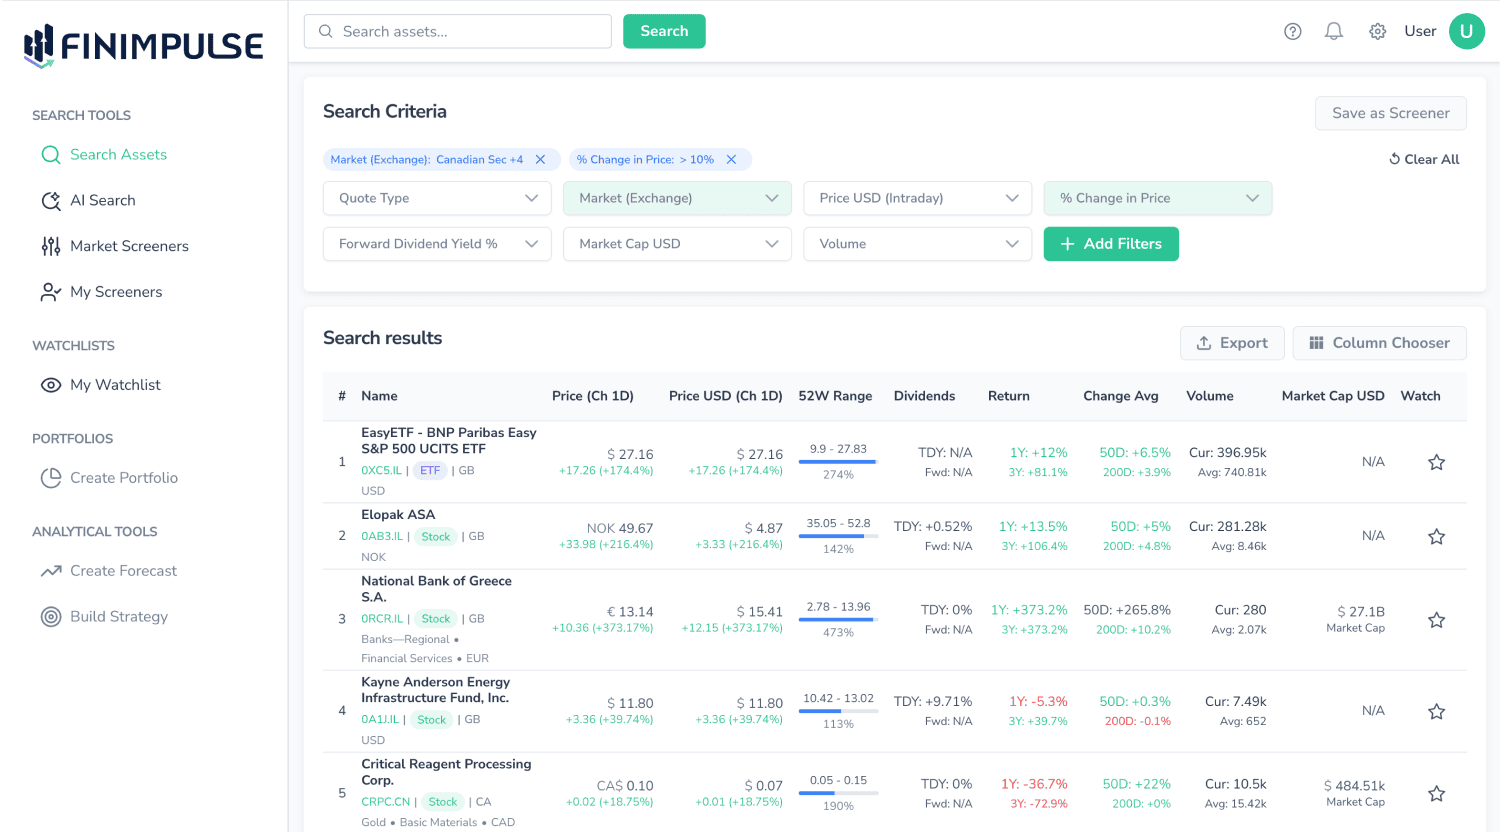

Analyze prices, returns, dividends, and volumes in a single view — fully comparable across 98 global exchanges.
All data, including prices, market caps, and historical OHLC, is normalized in USD to eliminate currency distortions.
All core metrics are directly comparable in a single table
Find stocks, ETFs, and funds across global markets in ~0.2 seconds. Filter by country, industry, performance, and more — across 614,000+ assets.
Create unlimited watchlists and custom screeners. Track trends, compare assets, and monitor markets in real time.
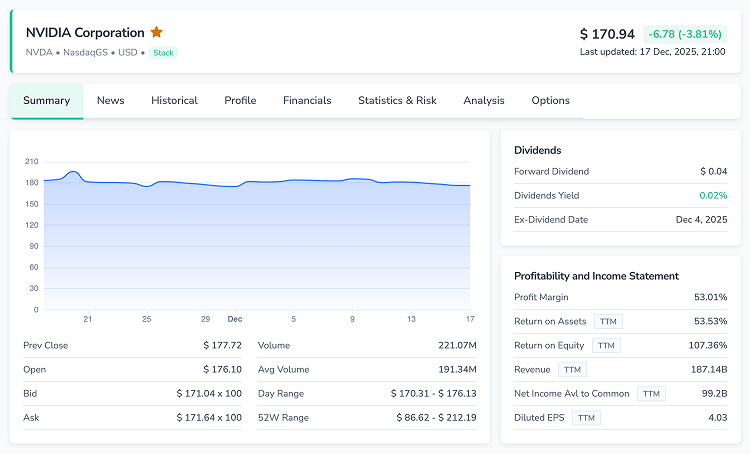
Analyze 20+ years of historical and fundamental data — prices, volumes, returns, and dividends. All data is normalized in USD for accurate multi-market comparison.
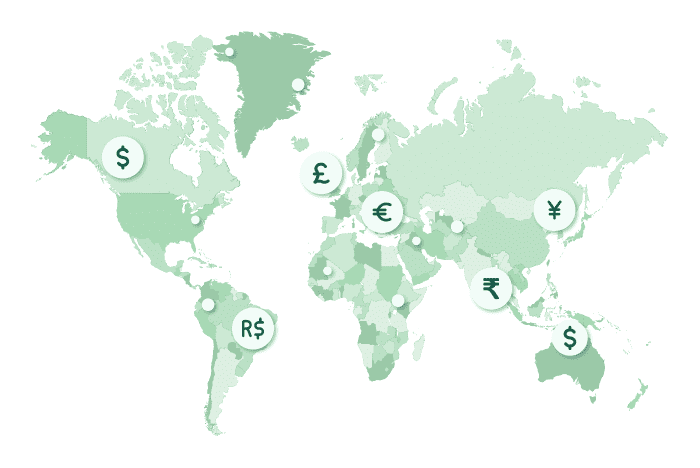
Access 614,000+ assets across 98 global markets. All prices are unified in USD for instant comparison, allowing you to analyze assets across regions, exchanges, and currencies in a single view.
FinImpulse fits naturally into research, analysis, reporting, and automation workflows — without locking you into a single interface

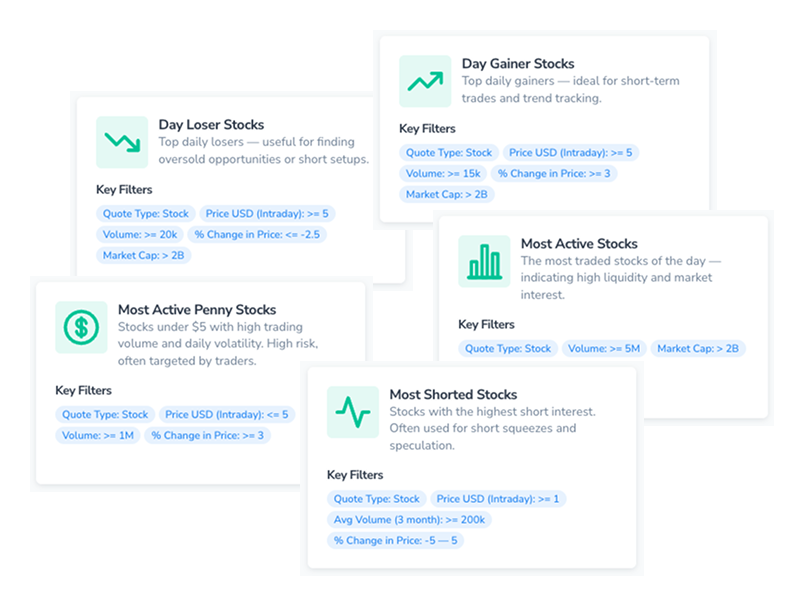
Create and save custom screeners tailored to your strategy. Combine filters, track conditions over time, and reuse your screeners whenever you need them.
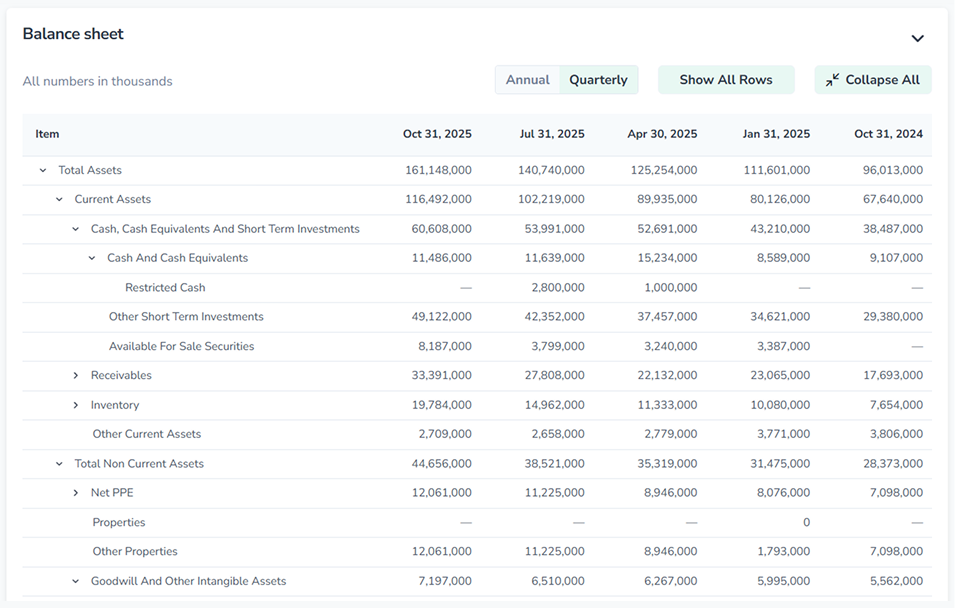
Access detailed financial statements for 30,000+ public companies worldwide. Analyze balance sheets, income statements, and cash flows with full historical depth.
Start with the Free plan to explore core features. Upgrade anytime to unlock advanced tools with a 14-day Premium trial.
Essential screeners, watchlists, custom columns, and advanced filters for tracking assets and running market screens.
Get startedFull exports, full financial statements, complete news history, and advanced research tools for deeper analysis.
Get startedUnlimited screeners, watchlists, and tracked items. Complete exports, advanced filters, financial statements, and priority support.
Get startedFinImpulse supports a wide range of workflows — from education and research to portfolio analysis and long-term investing.
Compare stocks, ETFs, and funds in a single table with prices unified in USD. Analyze performance, valuations, and key metrics across markets without manual adjustments.
Build simple screeners to demonstrate how market filters and asset selection work in real time. Use live data to explain comparisons, trends, and portfolio basics.
Track dividends and long-term returns across global markets in one dashboard. Review historical performance and income data without switching between tools.
Explore ETFs and diversified instruments to understand market behavior. Compare allocations and test ideas using historical and normalized data.
Identify trends across regions, sectors, and industries using consistent market data. Compare assets globally to support informed allocation decisions.
Monitor stocks, ETFs, and funds from multiple markets in a single dashboard. Keep a unified view of assets across exchanges and currencies.
Articles covering market concepts, key metrics, product guides, and FinImpulse updates — with clear explanations and real data examples.
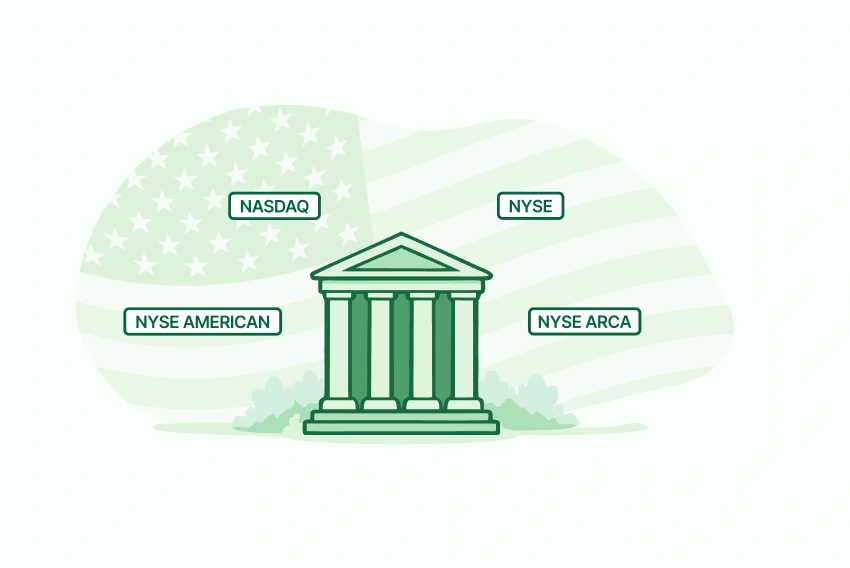
A breakdown of how the major American trading venues differ in structure, listings, and the instruments they serve.
High alpha explained — why it can mislead and what other metrics matter for a full assessment.

An overview of why countries have multiple exchanges, how each venue fits into the broader market, and a full list of exchanges by region.
Search, compare, and track stocks, ETFs, and funds across global markets — all from a single account.