Search
Find any stock, ETF, or fund worldwide in just 0.2 seconds. Filter by country, sector, industry, currency, performance, and more. Identify the right opportunities among 700,000+ assets.
Explore global investment opportunities with real-time and historical data. Search, filter, and compare assets — then save your picks into watchlists and screeners for faster, smarter decisions


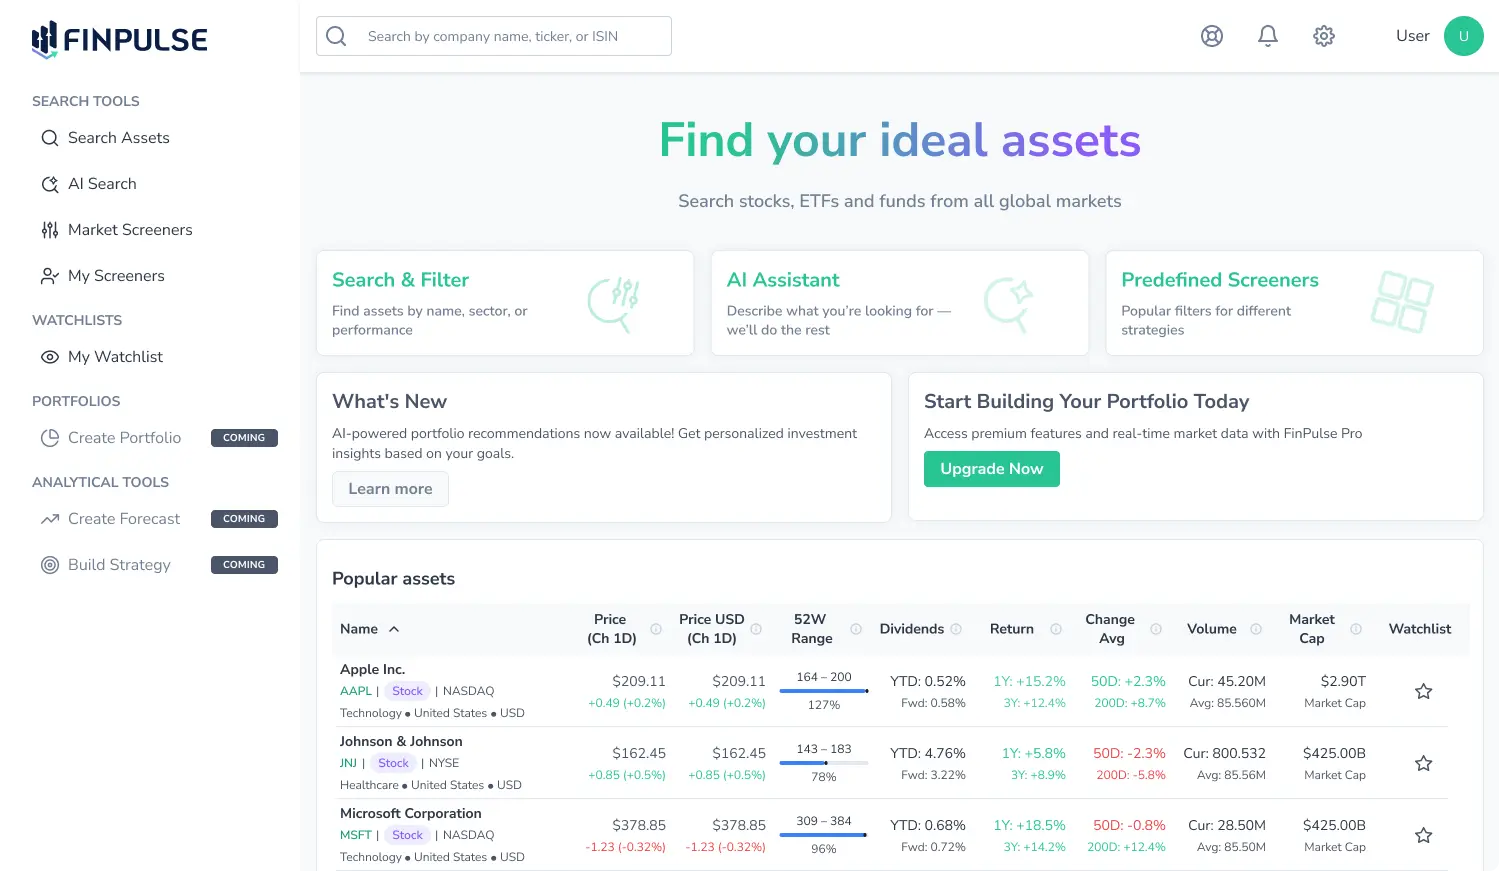

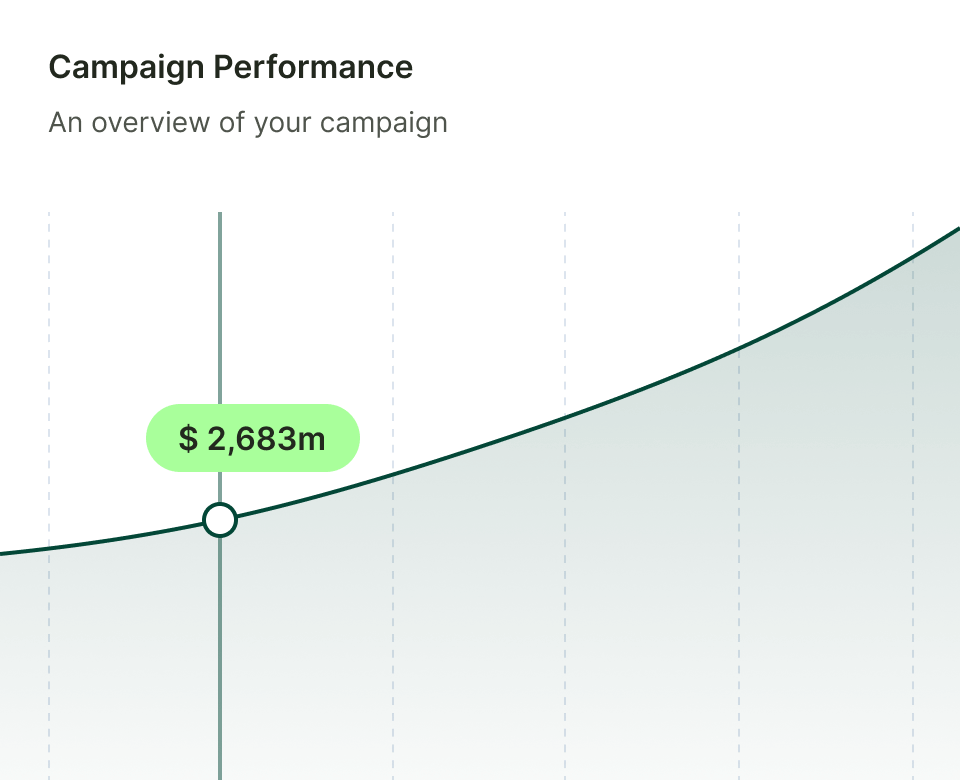
Investigate dividends, returns, prices, and volumes in one view — instantly comparable across 98 global exchanges. All values — including prices, market caps, and historical OHLC — are normalized in USD to eliminate currency distortions.
All key metrics are instantly comparable in one table
Find any stock, ETF, or fund worldwide in just 0.2 seconds. Filter by country, sector, industry, currency, performance, and more. Identify the right opportunities among 700,000+ assets.
Create unlimited watchlists and build custom screeners to track trends, compare assets, and identify market opportunities in real-time.
Explore 20+ years of historical and fundamental data: prices, volumes, returns, dividends, sector and country insights — data is fully normalized in USD for accurate multi-market comparison.
Search without limits — 700,000+ assets across 98 markets. All prices are unified in USD for instant comparison, allowing you to explore the entire global market at once.
All key metrics are instantly comparable in one table

Go beyond predefined filters. Create and save your own screeners to match your strategy, track signals, and return to them anytime.
Access the most comprehensive set of company reports worldwide. From 30,000+ public firms, get full fundamentals to analyze performance in detail.
Start with the Free plan and explore core features instantly. Want more? Try the full Premium experience with a 5-day free demo before upgrading.
Get started with 5 custom screeners, 1 watchlist, and up to 20 tracked items. A simple way to explore core features at no cost.
Get startedFor active users: 20 screeners, 5 watchlists, and 150 items. Includes data export, custom columns, advanced filters, and email support.
Get startedAdvanced toolkit with 50 screeners, 20 watchlists, and 2,000 items. Full exports, filters, custom columns, financial statements, and live chat.
Get startedFull access without limits: unlimited screeners, watchlists, and items. Complete exports, advanced filters, financial statements, and priority support.
Get startedFrom entrepreneurs to educators, anyone can use FinImpulse to explore markets, compare assets, and make investment decisions with confidence
Compare stocks, ETFs, and funds side by side in one table — with prices unified in USD.
Entrepreneur exploring investments
Better decisions by spotting undervalued assets
Build simple screeners and show students how market filters work in real time.
Finance Educator
Less prep time for teaching materials
Track dividends and long-term returns across 100+ markets without switching tools.
Retiree managing savings Hill
More stable portfolio income
Explore insightful content that keeps you ahead of the curve to the pulse of what's happening.

An explanation of how dividends work and how they generate steady passive income.
A simple breakdown of what a 1-year return shows and how to read it correctly.
A quick overview of essential long-term investing metrics and how to use them.
Search, compare, and track assets worldwide in seconds — with one account.